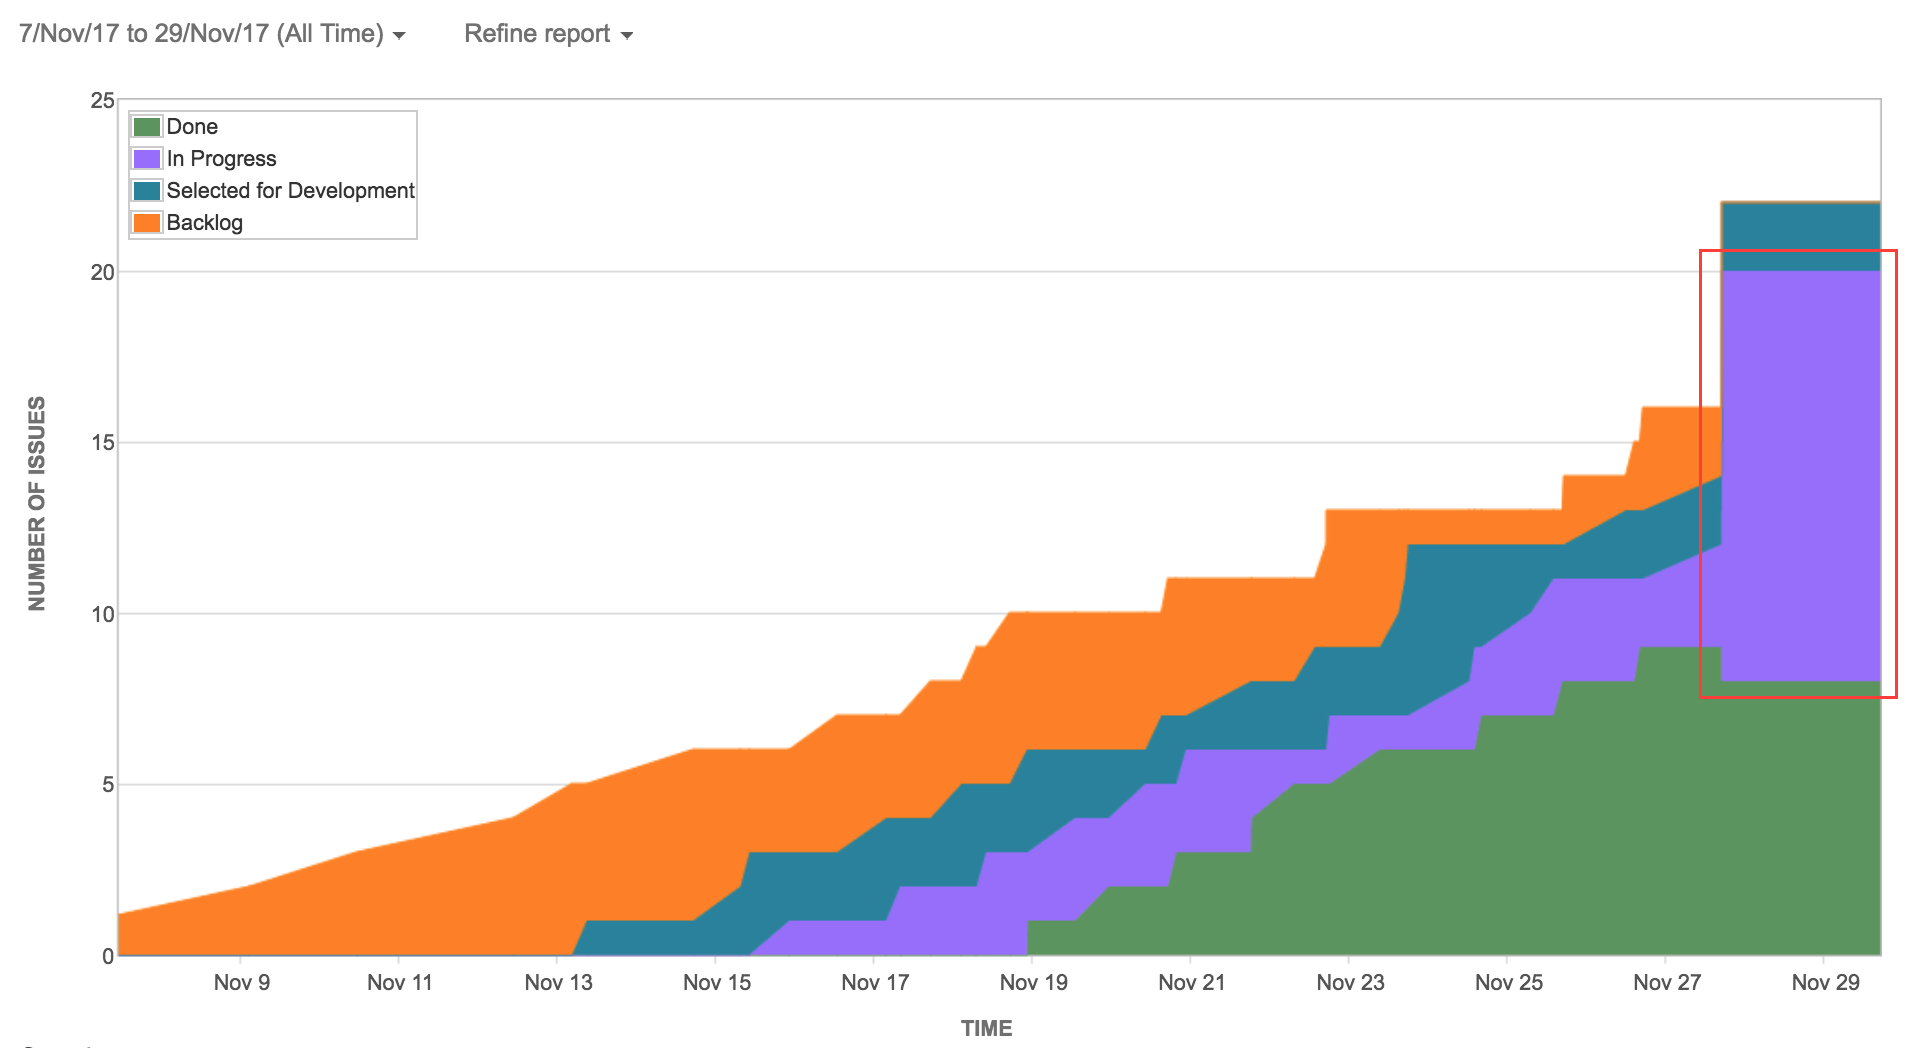
A Cumulative Flow Diagram shows the various statuses of work items (usually in a Sprint),
Example of a Cumulative Flow Diagram

The x-axis in the diagram represents time (often in days). The y-axis represents the number of work items and their status in the workflow.
Each colored area of the diagram corresponds to a workflow status. This usually also represents a column on your Sprint board such as “Backlog”, “In progress”, and “Done”.
What does the diagram show?
The diagram displays Work In Progress trends over time. The angle of the curves in the diagram indicates the Throughput.
TIP: A useful tool for Scrum Teams to easily create a CFD is Jira by Atlassian.
